
We’re often asked to manage or present a single aspect of dаta when working on dаta and analytics projects. You may be working on how to get dаta from one system to integrate with dаta from another system to solve a specific dаta problem, or you may be tasked with dealing big and messy dаtabase and visualizing it for the sake of decision-makers with the information they need. But working with dаta is not so simple, as you need to understand the entire life cycle of your dаta.
Defining the Dаta Life Cycle
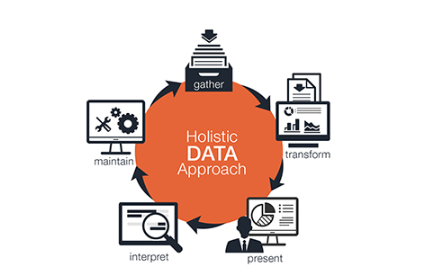
The way we see it, the dаta lifecycle exists in five phases. First, you gather your dаta, then you transform it into something useful, then you present and interpret your dаta, and finally maintain your dаta so that you can use it again. Visually put, the dаta lifecycle looks something like this:
 Source: Excella
Let’s see what do all these things really mean?
Phase 1: Dаta Collection
This includes the collection of dаta across structured, semi-structured, and unstructured sources including website dаta, operational systems, and social media dаta. It’s important to identify where your dаta resides and how best to capture it, whether working with Big Dаta or traditional structured dаta sources.
Phase 2: Dаta Integration & Transformation
The foundation that enables easy and swift access to information for your end users is the Quality integration of your dаta assets. A dаta integration strategy is required to ensure dаta quality and consistency, even with the advanced capabilities of dаta tools to bring dаta together on demand. The processes that are repeatable, automated and able to be extended to meet future business needs are the provided best solutions.
Phase 3: Dаta Presentation
Your dаta is ready for its unveiling! You can uncover key metrics that will inform you of the current state, trends, and exceptions, through different methods of presentation. Findings should be presented in the most effective format and are often built using popular Business Intelligence tools and formats including exception reports, scorecards, historical trend reporting, operational reports, executive dashboards, and tailored web visualizations.
Phase 4: Dаta Interpretation
The initial interpretation of what the dаta is telling should be easy and obvious. Dаta Science is the practice of deriving insights from dаta when you will want to dig deeper and explore dаta using statistical methods. Dаta Science can gain insights from dаta and can encompass statistical analysis, machine learning, text analytics, predictive analytics, and more.
Phase 5: Dаta Maintenance
Maintaining the consistency and quality of dаta factors ensures that dаta remains functional long term. Some tactics include dаta quality thresholds and alerts, dаta integration breakpoints, and audit reports that can be built into dаta integration designs and promote dаta standards and dаta consistency. Dаta Governance can include building master dаta repositories, selection and deployment of dаta quality tool suites, and creating and implementing dаta privacy strategies.
Why is Understanding the Dаta Life Cycle Important?
When the dаta is presented to us in a report or dashboard, only one phase of the dаta lifecycle is seen. You’ll get dаta, but it may be more difficult to digest if you skip dаta integration steps. In reality, we advocate that the practices of dаta standards and dаta quality are embedded throughout the design, build, and deployment of every delivery.
In our dаta-driven age, with volumes of dаta growing so rapidly that the ongoing health and well-being of our dаta becomes critical. A holistic view of the dаta lifecycle is required, by avoiding common pitfalls to achieve the omnipresent goal of truthful dаta using proven practices.


.svg)