Course Description
What does the course offer ?
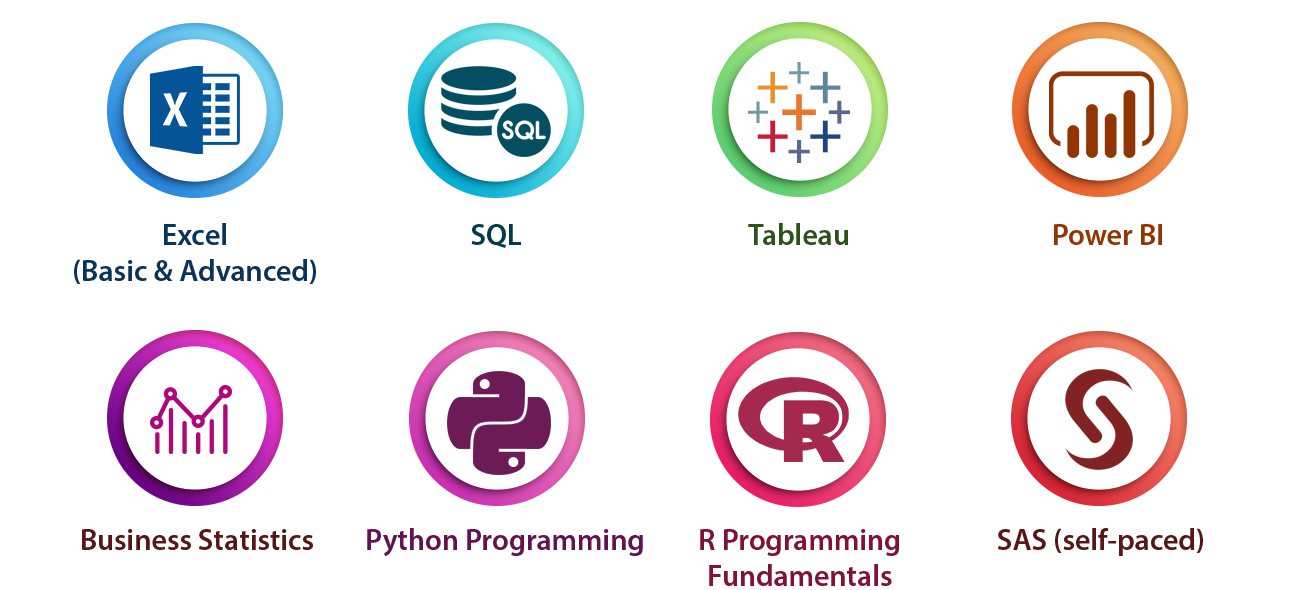
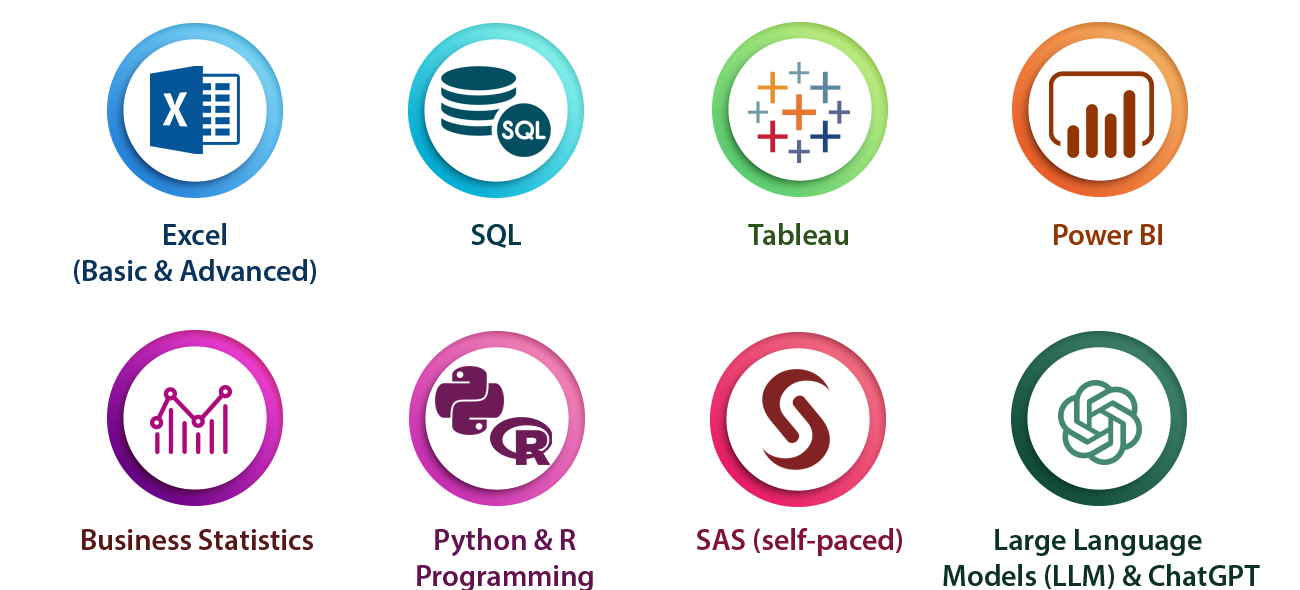
The Data Analyst Course covers technologies like Excel, Advanced Excel, Tableau, SQL, Power BI, Basics of R & Python. Apart from the theory classes, there are hands-on assignments and projects that help you apply the concepts that are learnt by a student.
Advanced Certification Program in Data Science and AI for Digital Transformation from IITM Pravartak:
ExcelR, in association with IIT Madras, brings to you an add-on certification for your Data Science Course.
This certification program provides you with:
- 15+ Hours of Interactive Live-Virtual Sessions by professors of IIT Madras.
- Optional 2-day Campus Immersion in the beautiful, state-of-the-art IIT Madras.
- A prestigious IIT Madras Pravartak Certificate.
What is the certification process?
During the period of your course, interactive live-virtual sessions will be conducted by professors of IIT Madras. An optional campus immersion will also be planned, whereby a slot will be created, and you will travel to Chennai for a two-day experience at the IIT Madras campus. Post training, you will take a short quiz on the topics discussed in the session, which will unlock your Advanced Certification Program in Data Science and AI for Digital Transformation from IITM Pravartak.
Program Highlights

Top-Notch Faculty
Trainers at ExcelR are passionate about training, and carry 12+ years of industry experience.

Exhaustive Course Curriculum
Our industry-relevant course curriculum is tailored to provide practical exposure with the theory.

Real-life Projects and Bootcamps
Learners will work on real-life data analytics scenarios from various domains to get application knowledge.

Job Readiness
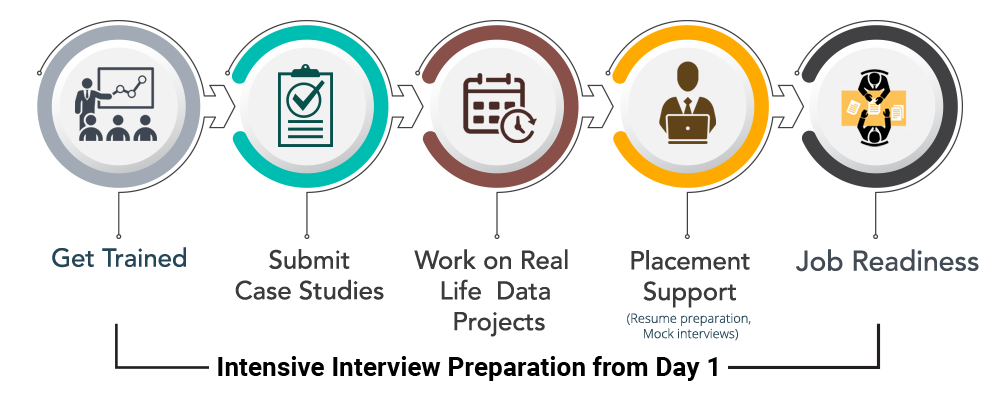
Intensive interview preparation from Day 1 to prepare candidates for interviews with our network of 2000+ hiring partners.
Skills Covered
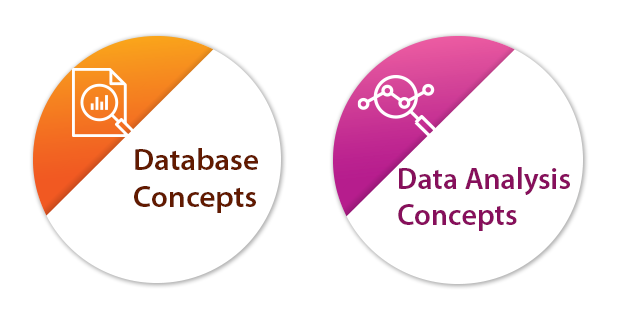
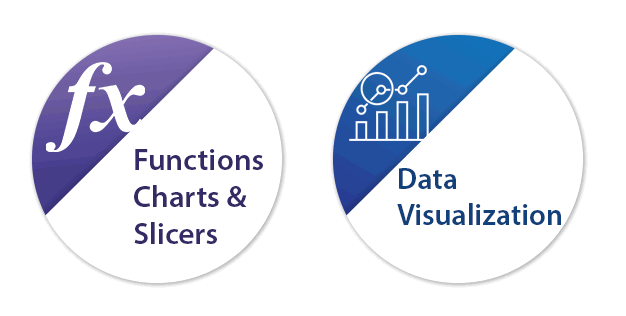
Tools and Technologies
Data Analyst Project Life Cycle
- After carefully evaluating the business case in a particular domain, data will be collected surrounding it.
- Using SQL, a database will be created to store the data collected in the previous step.
- Establish a connection between the database and Tableau/Python/R tools to extract the required data. Generate user-friendly reports according to the business needs and develop the dashboard using Tableau/Power BI.
Projects
- This project requires learners to analyze the patient data of those suffering from different diseases across various summaries. The facility, chain organizations, and dialysis stations analysis is required to be carried out where the patients are undergoing dialysis. The project also focuses on the payment mode aspect wherein if any discounts or reduction in payments have happened then those are analyzed.
- In this project, learners analyze the loan given by a financial institution to different customers of varied grades and sub-grade levels. The analysis needs to consider the loan disbursement reasons, funded amount, and revolving balance values for every customer in different states and geolocations. The project requires the customers payment modes and the last payment values.
- This HR-related project considers the attrition rate of employees working at an organization at different levels. The attrition rate analysis is done with respect to different factors such as monthly income, last promotion year, job role, and work-life balance of every employee of different departments.
- The project requires learners to analyze the usage of different fuels in different facilities in different applications by finding the MMBTu and GWHt values. The fuels used for different geo-locations and for different primary titles are also taken into consideration while doing analysis.
- The primary aim of the project is to determine the different reasons behind the delay of flights of various airlines. The analysis needs to consider the number of flights in operation, the number of flights cancelled, and the statistical summary of week-wise, state-wise, and city-wise flight distributions.
- The market for a certain product is analyzed by considering a particular retail outlet which sells these products. The project involves statistical analysis on the payment distribution from different customers with the different modes of transactions across different product categories. The feedback from customers with respect to shipping days and other factors also needs to be considered while carrying out the analysis.
Learning Path
Why ExcelR

Industry-Based Course Curriculum

Value Adds: Python Programming, Fundamentals of R, Business Statistics, SAS

Work Hands-on With 50+ Labs, 30+ Assignments, and 1500+ Interview Preparation Questions
Dedicated Placement Cell

Support through WhatsApp, Calls, & Emails

Lifetime eLearning Access
Course Curriculum
What does the course offer ?
The Data Analyst Course covers technologies like Excel, Advanced Excel, Tableau, SQL, Power BI, Basics of R & Python. Apart from the theory classes, there are hands-on assignments and projects that help you apply the concepts that are learnt by a student.
Program Highlights

Top-Notch Faculty
Trainers at ExcelR are passionate about training, and carry 12+ years of industry experience.

Exhaustive Course Curriculum
Our industry-relevant course curriculum is tailored to provide practical exposure with the theory.

Real-life Projects and Bootcamps
Learners will work on real-life data analytics scenarios from various domains to get application knowledge.

Job Readiness
Intensive interview preparation from Day 1 to prepare candidates for interviews with our network of 2000+ hiring partners.
Skills Covered


Tools and Technologies
Data Analyst Project Life Cycle
- After carefully evaluating the business case in a particular domain, data will be collected surrounding it.
- Using SQL, a database will be created to store the data collected in the previous step.
- Establish a connection between the database and Tableau/Python/R tools to extract the required data. Generate user-friendly reports according to the business needs and develop the dashboard using Tableau/Power BI.
Projects
- This project requires learners to analyze the patient data of those suffering from different diseases across various summaries. The facility, chain organizations, and dialysis stations analysis is required to be carried out where the patients are undergoing dialysis. The project also focuses on the payment mode aspect wherein if any discounts or reduction in payments have happened then those are analyzed.
- In this project, learners analyze the loan given by a financial institution to different customers of varied grades and sub-grade levels. The analysis needs to consider the loan disbursement reasons, funded amount, and revolving balance values for every customer in different states and geolocations. The project requires the customers payment modes and the last payment values.
- This HR-related project considers the attrition rate of employees working at an organization at different levels. The attrition rate analysis is done with respect to different factors such as monthly income, last promotion year, job role, and work-life balance of every employee of different departments.
- The project requires learners to analyze the usage of different fuels in different facilities in different applications by finding the MMBTu and GWHt values. The fuels used for different geo-locations and for different primary titles are also taken into consideration while doing analysis.
- The primary aim of the project is to determine the different reasons behind the delay of flights of various airlines. The analysis needs to consider the number of flights in operation, the number of flights cancelled, and the statistical summary of week-wise, state-wise, and city-wise flight distributions.
- The market for a certain product is analyzed by considering a particular retail outlet which sells these products. The project involves statistical analysis on the payment distribution from different customers with the different modes of transactions across different product categories. The feedback from customers with respect to shipping days and other factors also needs to be considered while carrying out the analysis.
Learning Path

Why ExcelR

Industry-Based Course Curriculum

Value Adds: Python Programming, Fundamentals of R, Business Statistics, SAS and ChatGPT

Work Hands-on With 50+ Labs, 30+ Assignments, and 1500+ Interview Preparation Questions
Dedicated Placement Cell

Support through WhatsApp, Calls, & Emails

Lifetime eLearning Access
Contact Our Team of Experts


.jpg)


