During my college days, Mathematics was one of my favorite subjects, especially geometry. Similar was the case of other students as well. Corroborative to that we had the best teacher who was also very generous in the evaluation. Hence > 50% of students used to score >70%. On the other hand, economics was toughest so was our ma’am. My peers used to satiate even if they fall in second class in economics. Though I was aware of the distribution pattern of our marks in maths and economics, I had absolutely no idea about the terms and concepts of skewness during those days.
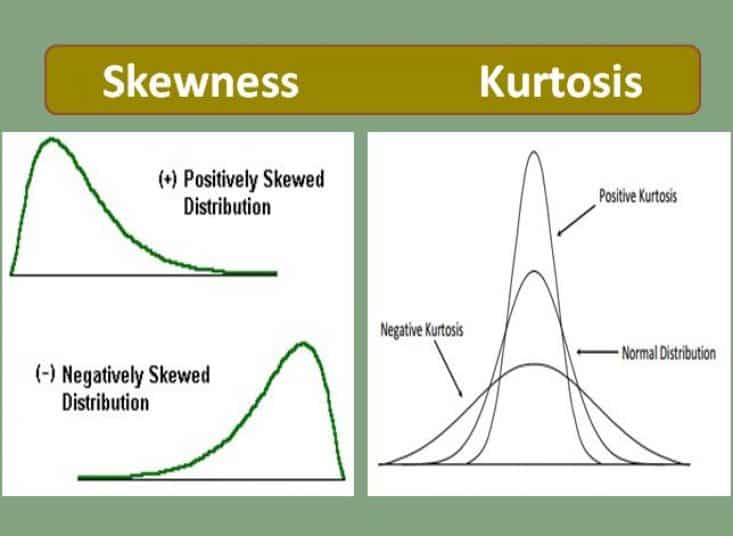
Skewness is the measure of the symmetry of the distribution. The distribution of the dаta is said to be normal if we get a bell-shaped curve wherein the dаta is symmetric across the mean (or median or mode, which are all equal; the figure at the centre below). The skewness is said to be zero in this case.

If we look at the distribution of marks of maths that is discussed above, a majority of the dаta falls right to mean, and the dаta is said to be negatively skewed. As we see here the mean is lesser than the median (and mode). In opposition, the distribution of economics marks is positively skewed, where more students score fewer marks and dаta is concentrated to the left of the mean. Here the mean is more than the median (and mode).
There are several ways by which we can estimate the amount of skewness in the dаta. Based on the method, we have four co-efficient of skewness:
Thus skewness speaks about the manner in which the dаta is spread across the mean. However, the dаta could be concentrated across the mean or dispersed equally across it which determines the peakedness of the curve. This measure is termed as Kurtosis which indicates the way in which the values are bundled across the centre of dispersion. Based on the extent of peakedness the kurtosis are differently termed, as illustrated in below picture:
If the dаta is more concentrated closer to the mean it is called as leptokurtosis. As the dаta gets more disperse, the peakedness reduces and the curve becomes Mesokurtic and if the dаta is much more dispersed, it is termed as platy kurtosis. It is interesting to note that,unlike skewness, in kurtosis the mean and median are same,and dаta is symmetrically spread across the mean, hence kurtosis would never take a negative value. Similar to skewness, there are different methods to measure kurtosis:
Kurtosis and skewness thus are the measures of spread and peakedness of the dаta, which are called third and fourth-moment business decisions respectively.


